Make any web visualization interactive via pan and zoom, for mobile and desktop, using just one line of code!


Bookmark

With the EasyPZ browser bookmark, you can turn any SVG into an interactive visualization with pan and zoom. When browsing the web and seeing a vector graphic you want to zoom in on, simply click the EasyPZ bookmark and explore the visualization in much greater detail!

Drag the link into your bookmarks now: » EasyPZ «

Then try it on any SVG-based visualization, for example by opening the US Map of Nielsen Media Markets, activating the EasyPZ bookmark and then zooming in to the visualization.


Simple Automatic Mode for SVG

To make any visualization zoomable on mobile and desktop using EasyPZ, simply include:

<script src="https://unpkg.com/easypz@latest/easypz.js"></script>
<script
    src="https://unpkg.com/easypz@latest/easypz.js">
</script>

If you're using SVG, you can then assign an easypz attribute to the visualization you want to make zoomable. If you want EasyPZ to simply make all elements of your SVG zoomable, set "applyTransformTo": "svg > *", and EasyPZ will take care of the rest:

If you want the transformation to only happen on specific elements, you can change the selector:
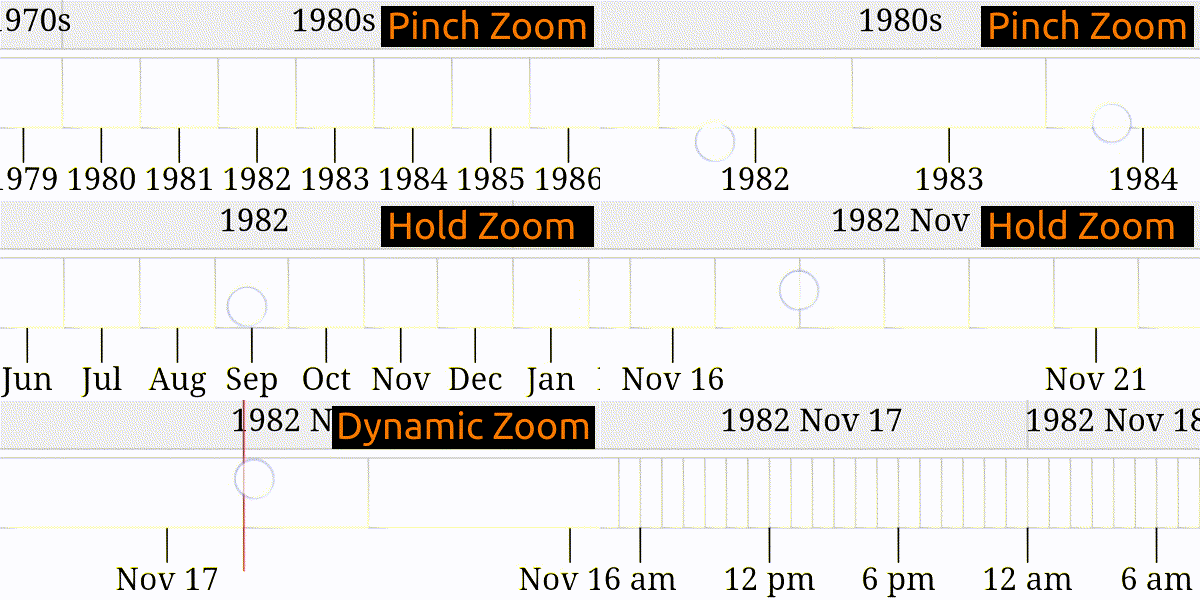
Advanced Manual Mode

If you're not using SVG (e.g. canvas or webGL), or if you want more fine control over what happens when the user pans and zooms, you should consider a manual implementation of pan and zoom using EasyPZ.

Below, there is an example of using EasyPZ in a canvas environment.

More explanation and examples, including a comparison with d3.zoom, can be found in our documentation.

About

This work was done as a collaboration between the InterVis Group at Northeastern University, and James Tompkin's and Jeff Huang's groups at Brown University. Please feel free to reach out! We're excited to get people to use EasyPZ in their interactive visualizations, for their research, and more!